Blog

  • Remote Teams Don’t Have a Productivity Problem — They Have a Visibility Problem

    Ask a manager of a distributed team what worries them, and “productivity” is rarely the honest answer. What they actually mean is: I can’t see what’s happening, and the not-knowing is the stressful part. Those are two very different problems, and most companies spend years trying to solve the first one when it’s really the second.

    The Wrong Question

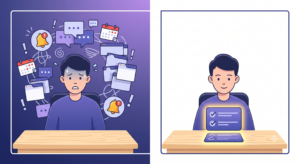
    “Is my team working hard enough?” assumes the issue is effort. In practice, most remote and hybrid teams are working plenty — the problem is that none of that work is legible from the outside. A closed laptop at 2pm could mean someone stepped away, or it could mean they’re deep in a 90-minute focus block with notifications off. Without real data, a manager has to guess, and guessing under uncertainty tends to default to suspicion.

    Visibility isn’t about watching harder. It’s about replacing guesses with facts everyone — including the employee — can see.

    What Visibility Actually Looks Like

    Real visibility isn’t a keylogger and a stream of screenshots. It’s a small set of honest signals, tracked consistently and shown to everyone the same way. In practice, that’s a live read on the whole team, not a once-a-week status report:

    • Activity scored from real input, not assumed from hours logged
    • Idle time detected fairly, with thresholds the organization controls
    • Deep, uninterrupted focus work called out — not punished for looking quiet
    • The exact same dashboard available to the employee it’s about

    None of this requires trusting anyone less. It requires trusting the data more than the anxiety.

    The Trust Paradox

    Here’s the part most monitoring vendors get backwards: the more invisible the tracking, the less anyone trusts it — manager and employee alike. A manager who only sees a vague “activity score” doesn’t trust the number. An employee who doesn’t know what’s being tracked doesn’t trust the manager. Secrecy doesn’t protect anyone; it just moves the anxiety around.

    TrackDots scores every activity block from 0–100 using real keystroke and mouse signals — and shows employees the exact same score their manager sees. See how Time Tracking works →

    What Changes

    Once a team has real visibility, the conversation changes shape. Managers stop asking “were you working” and start asking “what got in the way.” Employees stop feeling watched and start feeling seen. Neither of those things happen because someone tried harder to trust each other — they happen because the data made trust unnecessary to negotiate every day.

  • The Hidden Cost of Untracked Time: A 2026 Data Breakdown for Remote & Hybrid Teams

    The Hidden Cost of Untracked Time: A 2026 Data Breakdown for Remote & Hybrid Teams

    Every manager has said some version of the same sentence: “My team is busy all day, but somehow nothing gets done faster.” That gap — between hours logged and value produced — has a name. It’s called untracked time, and it’s one of the few line items in a company’s budget that nobody officially owns, nobody reports on, and almost nobody measures.

    That’s the problem with this specific kind of cost: it doesn’t show up as a single expense you can point to. It’s spread across hundreds of small moments — a slow morning startup, an unplanned 40-minute meeting that could’ve been an email, twenty minutes lost re-focusing after a Slack ping. Individually, none of it looks alarming. Multiplied across a team, a quarter, a year — it becomes one of the largest hidden line items most companies never audit.

    This article isn’t about guilt-tripping employees into working harder. It’s about giving you a repeatable way to calculate what untracked time actually costs your specific team, using your own headcount and salary numbers — and what the data suggests actually moves the needle once you know the number.

    Key Takeaways

    • Untracked time typically eats 15–40% of the paid workday — use 25% as a conservative estimate if you’ve never measured it.
    • At 100 employees, untracked time can cost the equivalent of 31 full-time salaries every year — an entire hidden department.
    • The three biggest leaks are idle time (~30%), app/context switching (~22%), and oversized meetings (~18%).
    • This is a visibility problem, not a laziness problem — the fix is continuous, real-time data, not more oversight.
    • Run the formula below with your own headcount and salary numbers to get your team’s actual annual cost.

    Why “Busy” and “Productive” Are Not the Same Metric

    Time tracking gets a bad reputation because it’s often implemented as surveillance rather than as a diagnostic tool. But the goal isn’t to watch people — it’s to answer one question honestly: where does the paid workday actually go?

    Most organizations only measure attendance (clock-in, clock-out) and output (deliverables, revenue). The middle layer — how the hours between those two points are actually spent — is a blind spot. And it’s precisely in that blind spot where the cost accumulates:

    • Time spent context-switching between tools and tasks
    • Idle or inactive stretches that never get flagged
    • Meetings that run long or shouldn’t have existed
    • Manual admin work that a dashboard could report in seconds
    • Rework caused by unclear priorities, not lack of effort

    None of these show up on a P&L statement as “wasted time.” They show up as slower delivery, missed deadlines, and quietly inflated headcount — a company hiring its way around an efficiency problem instead of solving it.
    The Untracked Time Cost Formula

    Here’s a simple framework you can run with your own numbers in under five minutes. It doesn’t require new software to estimate — only to actually close the gap once you know it.

    Step 1 — Establish your blended hourly cost.

    Hourly Cost = (Annual Salary + Benefits & Overhead) ÷ Working Hours per Year

    Most companies use ~2,080 working hours/year (40 hrs × 52 weeks) and add 20–30% on top of base salary for benefits/overhead.

    Step 2 — Estimate your untracked time percentage.

    This is the share of the paid workday that isn’t going toward focused, attributable work. Independent workplace-analytics studies conducted across monitored teams commonly report ranges between 15% and 40% of the workday, depending on role, tooling maturity, and how distributed the team is. If you’ve never measured it, 25% is a reasonable, conservative starting assumption for a hybrid/remote team with no visibility tooling in place.

    Step 3 — Multiply it out.

    Annual Cost per Employee = Hourly Cost × Working Hours per Year × Untracked %

    Worked Example

    Input Value
    Average annual salary $55,000
    Overhead/benefits (+25%) $68,750
    Working hours/year 2,080
    Blended hourly cost $33.05
    Estimated untracked time 25%
    Annual cost per employee $17,182

    That’s the cost of a single employee’s untracked time — not their salary, just the inefficient slice of it. Scale that across a team, and the number stops being abstract very quickly.

    What This Looks Like at Different Team Sizes

    Using the same $33.05/hr blended rate and 25% untracked-time assumption:

    Team Size Annual Cost of Untracked Time Equivalent To
    10 employees $171,820 ~3 full-time salaries
    25 employees $429,550 ~7.8 full-time salaries
    50 employees $859,100 ~15.6 full-time salaries
    100 employees $1,718,200 ~31 full-time salaries
    250 employees $4,295,500 ~78 full-time salaries
    $1,718,200
    The estimated annual cost of untracked time for a 100-person team — equivalent to funding an entire extra department, every year, until it’s measured.

    That middle column is the number worth sitting with. At 100 employees, untracked time is quietly costing the equivalent of an entire additional department — every single year, indefinitely, until something changes how work is measured.

    Where the Hours Actually Go

    Untracked time isn’t one thing — it’s an accumulation of smaller leaks. Based on patterns commonly observed across distributed and hybrid teams once granular tracking is introduced, the breakdown typically looks something like this:

    Category Typical Share of Untracked Time What It Looks Like
    Idle/inactive stretches ~30% No keyboard/mouse activity, no active task, unexplained gaps
    App/context switching ~22% Bouncing between tools without a clear task boundary
    Unplanned or oversized meetings ~18% Meetings that run over, or shouldn’t have been meetings
    Manual status reporting ~12% Employees manually compiling “what I did today” instead of a system reporting it
    Ambiguous task ownership ~10% Time spent figuring out what to work on, not doing the work
    Other/miscellaneous ~8% Everything that doesn’t fit a clean category

    The important pattern here: almost none of this is about employees not working hard enough. It’s about the absence of a system that surfaces these patterns in real time, so they can be corrected in days instead of discovered in a budget review a year later.

    What Actually Closes the Gap

    Knowing the number is step one. Closing it requires visibility that’s continuous, not a one-time audit. In practice, three things move the needle fastest:

    • Idle and activity detection — surfacing genuinely inactive stretches automatically, instead of relying on self-reported timesheets that nobody fills out accurately.
    • Focus session tracking — giving employees and managers a shared view of deep-work blocks versus fragmented time, so context-switching becomes visible instead of invisible.
    • Productivity intelligence & anomaly detection — flagging unusual patterns (a sudden spike in idle time, a role consistently over-meeting) before they become a quarter-long trend baked into the budget.

    This is precisely the gap TrackDots is built to close — real-time visibility into where the workday actually goes, without turning it into a surveillance exercise. Instead of guessing at the 25% assumption used above, teams get their actual number, broken down by person, team, and project — and the tools to act on it immediately: idle-time alerts, focus-session reporting, anomaly detection, and productivity intelligence dashboards that update daily, not quarterly.

    A Quick Self-Audit: 5 Questions to Ask This Week

    Before rolling out any new process, run this quick gut-check across your team:

    • Can we say, with confidence, what percentage of paid hours last month went to focused, attributable work?
    • Do we know which meetings could be cut without anyone noticing?
    • Are status updates still manually compiled by employees instead of auto-generated?
    • Has “we’re just busy” been the explanation for a missed deadline in the last quarter?
    • Would a 25% untracked-time assumption be conservative, accurate, or optimistic for our team?

    If two or more of these gave you pause, the cost table above isn’t hypothetical — it’s already happening inside your P&L, just unlabeled.

    The Bottom Line

    Untracked time isn’t a people problem — it’s a visibility problem. Teams don’t lose 20–30% of their week because they’re lazy; they lose it because no system exists to catch the leaks while they’re still small. The formula above gives you a starting estimate. Real tracking gives you the actual number — and, more importantly, the ability to close the gap week over week instead of discovering it a year too late.

    See Your Actual Number

    Run the formula above with your own team’s numbers, then book a 30-minute walkthrough — we’ll show you what that percentage actually looks like broken down by person, project, and week inside TrackDots, live on real data, no slides.

    Book a Free Demo →

  • Why Confidence-Scored Time Tracking Beats Manual Timesheets

    A manual timesheet is a memory test disguised as a report. At the end of the week, someone tries to reconstruct five days of context-switching from memory, rounds every entry to the nearest half hour, and submits a document that looks precise but rarely is.

    What a Confidence Score Actually Measures

    Instead of asking someone to remember their day, confidence-scored tracking watches the real signals as they happen: keystroke cadence, mouse movement, app and window focus. Every activity block gets a 0–100 score based on how confidently the system can say real work was happening — not how long a timer happened to run.

    • No manual start or stop — tracking begins the moment work does
    • Every block scored independently, so one quiet hour doesn’t blow up a whole day’s number
    • Short gaps between active sessions merge automatically into one continuous block

    A timesheet answers ‘what do you remember doing?’ A confidence score answers ‘what actually happened?’ Those are rarely the same number.

    Why This Matters for Billing

    For any team billing clients by the hour, this distinction has a direct dollar value. A rounded, remembered timesheet is the first thing a client questions during an audit. A confidence-scored activity log, tied to real input signals, is the first thing that ends the conversation.

    Every block is scored the same way, whether it’s billed to a client or reported to a manager. Explore Time Tracking →

  • How to Spot Burnout Before It Costs You a Resignation

    By the time a resignation letter lands on your desk, the decision was usually made weeks earlier. What looks like a sudden departure is almost always the end of a slow, visible pattern — long days, disappearing breaks, work creeping into weekends — that nobody was tracking closely enough to catch.

    Six Signals Worth Watching

    • Long hours — consistent days well past a normal shift length
    • Missed breaks — no meaningful pause across an entire tracked day
    • Weekend work — activity logged on days that should be off
    • Late nights — work starting before 6am or continuing past 11pm
    • Declining productivity — a real drop against someone’s own baseline, not a generic average
    • Weekly hours over limit — sustained overload across multiple weeks, not just one busy sprint

    No single signal on its own means much — everyone has one long week. What matters is the combination, sustained over a rolling window, compared against each person’s own normal, not a company-wide average that flattens out real outliers.

    A burnout score isn’t a verdict. It’s a prompt to have a conversation before the conversation becomes an exit interview.

    Turning Signals Into a Number

    TrackDots rolls these six signals into a 14-day rolling risk score, classifying each employee as High, Medium, Watch, or All Clear — recalculated daily as new activity comes in. Every flagged employee comes with a plain-language recommendation, like “consider checking in” or “monitor this week,” not just a red number with no context.

    Thresholds for what counts as a long day or a late night are fully configurable per organization. See Burnout Detection →

    The Point Isn’t the Score

    The score exists to start a conversation a manager might otherwise have missed — not to replace one. The best outcome of a burnout flag is a five-minute check-in that never would have happened otherwise.

  • Sandwich Days, Explained: A Fair Way to Handle Attendance Edge Cases

    An employee takes leave on Friday and the following Monday. In between sits a weekend, or worse, a public holiday. Does that middle stretch count as leave too, or is it exempt? Most attendance policies never write down an explicit answer — they just quietly assume one, and HR finds out which assumption when someone disputes their payslip.

    Why “Just Pick One Rule” Doesn’t Work

    A blanket rule — always include, or always exclude — feels simple until it collides with a real case: a holiday deliberately used to extend a trip, versus a genuine coincidence of scheduling. Treating both identically is fair in the abstract and frustrating in practice.

    A sandwich day isn’t a rule to automate away. It’s a decision that deserves a human to actually look at it.

    The Better Default: Flag, Don’t Assume

    • Automatically detect when a weekend or holiday sits between two leave days
    • Flag it explicitly, rather than silently including or excluding it
    • Let HR make an include/exclude decision on that specific case
    • Never apply the same silent assumption to every employee regardless of context

    This keeps the system honest about the fact that some attendance edge cases genuinely need judgment — and makes sure that judgment is applied deliberately, not buried in a default nobody remembers configuring.

    Attendance windows, half-day cutoffs, and sandwich-day handling are all configurable per organization. See Attendance Tracking →

  • The Case Against Surveillance-Style Monitoring

    Most monitoring software is built around a one-way mirror: the manager sees everything, the employee sees nothing, and the entire relationship is designed around asymmetric information. We think that design choice is the actual problem — not monitoring itself.

    What Surveillance-Style Monitoring Gets Wrong

    When tracking happens in secret, three things reliably go wrong. Employees stop trusting the tool the moment they learn what it captures. Managers over-rely on numbers they don’t fully understand, because the system was never designed to explain itself to anyone. And the whole relationship shifts from “we’re on the same team” to “I’m being watched by someone who won’t show me what they see.”

    If a tool can’t survive being fully visible to the person it’s tracking, that’s a sign the tool — not the tracking — is the problem.

    What Transparent Monitoring Looks Like Instead

    • Employees see the exact same dashboard a manager sees — not a stripped-down version
    • Screenshot capture is optional and configurable, never silently on by default
    • Keystrokes are counted for scoring, never logged as content
    • Threshold changes apply going forward only — history is never quietly rewritten

    Why This Is a Business Decision, Not Just an Ethical One

    Transparent monitoring isn’t just the more comfortable choice for employees — it changes what managers can actually do with the data. A number nobody trusts gets ignored. A number everyone can see, including the person it describes, becomes something both sides can act on together.

    Every plan includes an employee self-view portal showing the same data a manager sees. Read our privacy principles →

    The Standard We Hold Ourselves To

    Every feature we ship gets tested against one question: would this still feel fair if the employee it affects could see exactly how it works? If the answer is no, we don’t ship it that way.

  • What a 14-Day Rolling Burnout Score Actually Measures

    “Burnout score” sounds like it should be squishy — some vague sentiment pulled from a survey nobody filled out honestly. TrackDots’ version is the opposite: a rolling calculation built entirely from real, observable activity over the last 14 days.

    The Six Inputs

    • Long hours — days that consistently run past a configured threshold
    • Missed breaks — no meaningful pause across the day
    • Weekend work — activity on days that should be off
    • Late nights — work outside a configured normal-hours window
    • Declining productivity — a real drop against that employee’s own baseline
    • Weekly hours over limit — sustained overload, not a single busy week

    Each signal is evaluated independently and shown that way — an employee’s flag might say “long hours, 6 days” and “late nights, 1 day” rather than a single blended number nobody can unpack.

    Four Tiers, Recalculated Daily

    Every employee lands in High, Medium, Watch, or All Clear, based on how many of the six signals are currently triggered. Because the window rolls forward every day, a single rough week doesn’t linger as a permanent red flag — the score reflects the last two weeks, not an entire quarter.

    A rolling window means the score describes right now — not a bad sprint from six weeks ago that everyone’s already recovered from.

    Every High or Medium flag comes with a plain-language recommendation, not just a number. See Burnout Detection →

    Configurable, on Purpose

    What counts as a “long day” or a “late night” varies by team, season, and culture. Every threshold behind this score is configurable per organization — and changes only ever apply going forward, never rewriting how past weeks were scored.

  • Introducing Anomaly Detection: Catching Patterns Before They Become Problems

    Most teams don’t lose track of one employee at a time — they lose track of dozens, a little at a time, until a pattern that was obvious in hindsight goes unnoticed for weeks. Anomaly Detection exists to catch those patterns while there’s still time to do something about them.

    Four Patterns, Flagged Automatically

    • No-activity streaks — ten or more consecutive weekdays with zero tracked activity
    • Sudden hour drops — a day’s hours falling sharply below someone’s own personal average
    • Erratic start times — a daily start time swinging widely across recent active days
    • Unusual working hours — work logged unusually early or late relative to someone’s normal pattern

    Every flag is ranked Critical, Warning, or Info, so a manager reviewing a team of twenty doesn’t have to treat every flag with the same urgency.

    The goal isn’t to flag everything. It’s to flag the handful of things a manager watching twenty dashboards would otherwise miss.

    Evidence, Not Verdicts

    Every anomaly links directly to the employee’s real activity diary and profile — nothing is presented as a conclusion on its own. A flag is a prompt to look closer, backed by the actual data behind it, not an automated judgment about anyone’s performance.

    Flags are ranked by severity and link straight to the underlying activity data. See Anomaly Detection →

  • The Real Cost of Manual Payroll Reconciliation

    Somewhere in most companies, a spreadsheet gets rebuilt every single month: attendance pulled from one system, leaves from another, manual adjustments tracked in a third, all reconciled by hand into something payroll can actually run against. The cost of that process rarely shows up as a line item — it shows up as a person’s entire last week of the month.

    Where the Hours Actually Go

    • Re-entering attendance data that already exists somewhere else
    • Manually calculating paid days from present/absent/half-day/leave records
    • Cross-checking PF and professional tax by hand, employee by employee
    • Chasing down one-off adjustments that never made it into the main record

    None of this is hard, exactly — it’s just repetitive, error-prone, and entirely avoidable when attendance and payroll already live in the same system.

    The most expensive part of manual reconciliation isn’t the hours it takes. It’s the one mistake that makes it into someone’s actual paycheck.

    What Attendance-Linked Payroll Looks Like

    When payroll reads directly from the same attendance data used everywhere else, paid days, PF, and professional tax calculate themselves — automatically, and consistently, every single run. Adjustments still happen, but they layer on top of the record instead of requiring it to be rebuilt.

    See a projected payroll run before the month even closes, recalculated as attendance comes in. See Payroll Management →

  • Why We Built Employee Self-View Into Every Plan

    It would have been easy to make employee self-view a premium add-on — plenty of monitoring tools do exactly that, treating an employee’s own visibility into their own data as a nice-to-have rather than a default. We decided early on that this wasn’t a feature to sell separately.

    The Reasoning

    If a piece of data is fair enough for a manager to see, it should be fair enough for the employee it describes to see too. Gating that behind a pricing tier would mean some employees get transparency and others don’t, based entirely on what their employer chose to pay for — and that’s not a distinction we were willing to make.

    Transparency isn’t a premium feature. It’s the thing that makes every other feature defensible.

    What This Actually Means in Practice

    • Every employee sees the same dashboard a manager would see for them
    • Attendance, focus sessions, and idle time are visible to the person they’re about, on every plan
    • Screenshot access, where enabled, extends to self-view too — nothing captured that the employee can’t also see
    • No plan strips this away to hit a lower price point

    The Trade-Off We Accepted

    This does mean self-view isn’t a lever we can pull to make cheaper plans look more different from expensive ones. We think that’s the right trade — a monitoring platform that only some employees can see into isn’t a platform we’d want to use ourselves.

    Self-view is included on every plan, not gated behind Business tier. See our pricing →